Supply vs Demand - How the Cycle Turns

As anyone who has taken a long-term view of property can attest, property markets continuously move in cycle and in Australia where each property market sits in the cycle depends on the strength of their respective local economy. A perfect example of this is when you observe conditions across the opposing sides of our continent: while Sydney’s property prices have been propelled by unprecedented demand, the Perth market has had to absorb a large amount of properties listed for sale.
While an array of metrics affect markets, supply and demand represents the greatest driver of the property cycle. LJ Hooker’s Head of Research Mathew Tiller said examining the capital cities of New South Wales and Western Australia illustrated various market ebbs and flows over the past 10 years.
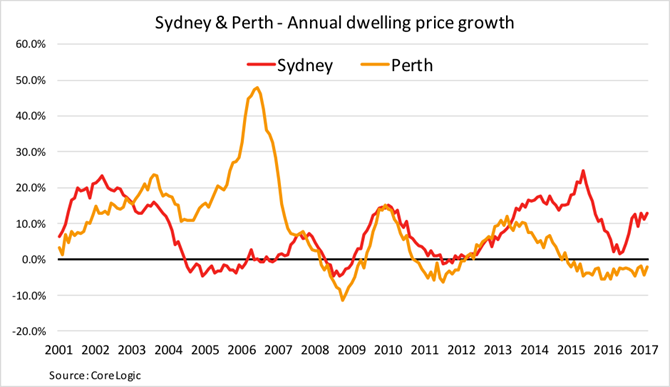
It might seem hard to believe in today’s environment, but 2004-2008 paints a very different picture for Sydney’s property scene, where the market contracted as unemployment rose and population growth fell flat.
“There were simply too many homes on offer than were needed in Sydney at the time,” said Mr Tiller. “Today’s buyers might think it unbelievable that prices could go backward, but that was the reality in Sydney from 2004-2008, when the median dropped from $515,000 to $475,000.
“But on the other side of the country, the property cycle was at a different point. WA’s market couldn’t keep up with the additional 250,000 residents chasing employment in resources and mining. Median property prices more than doubled from $265,000 to $605,000 and by as much as 30% per annum in regions such as the North West.”
However, Mr Tiller said today’s conditions showed the pendulum had swung back to the Eastern capital in what has become an ongoing tale of two cities.
Sydney’s (with a current median house price of $1,063,000) supply has been unable to meet demand created by record-low interest rates and lower unemployment; while mining investment in WA has slowed and population growth declined, resulting in Perth’s median house price softening by 2.1% over the past 12 months to $548,000.
However, the rate of change – growth in Sydney and moderation in Perth – has been slowing – could this be the first sign of the property cycle turning?
| State | City | Median Sale Price (12 months) |
Change in Median Price (12 months) |
Median Days on Market (12 months |
| NSW | Sydney | $1,063,000 | 12.9% | 31 |
| WA | Perth | $548,000 | -2.1% | 73 |
In any event, any real estate decision should be viewed as a long-term strategy. Savvy buyers and sellers look beyond the immediate conditions, recognising opportunities in all phases of the property cycle. Indeed, in some instances, counter-cyclical transactions can yield the highest results.
But real estate should be viewed as a long-term investment. And despite the rises and falls of property cycles, capital city markets generally move on an upward curve.
DISCLAIMER - The information provided is for guidance and informational purposes only and does not replace independent business, legal and financial advice which we strongly recommend. Whilst the information is considered true and correct at the date of publication, changes in circumstances after the time of publication may impact the accuracy of the information provided. LJ Hooker will not accept responsibility or liability for any reliance on the blog information, including but not limited to, the accuracy, currency or completeness of any information or links.
Share


